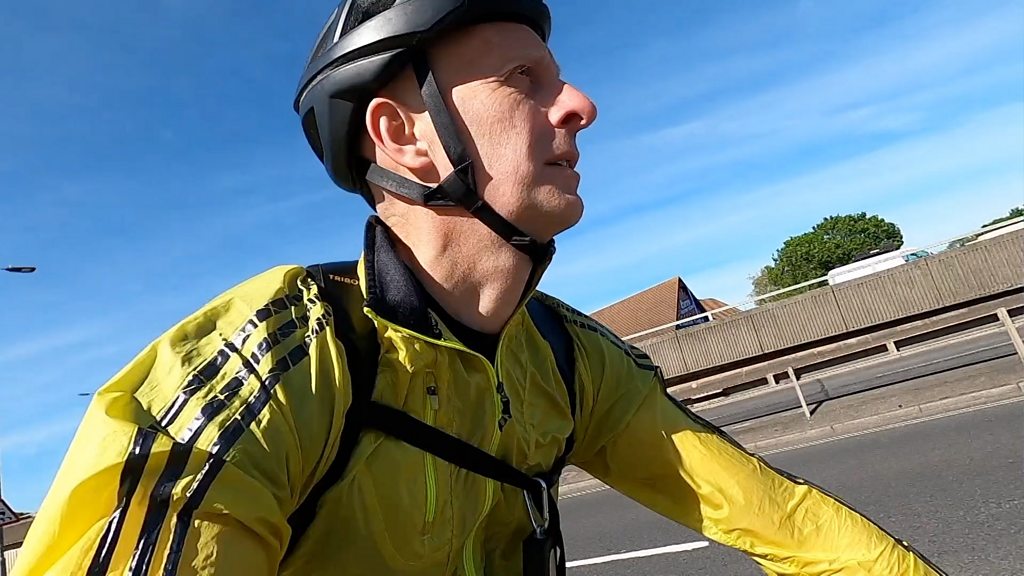
A nine-mile daily cycle commute through Dartford has exposed a silent health emergency, with air pollution levels spiking to three times the World Health Organization’s annual limit for fine particulate matter (PM2.5). University of Portsmouth researchers, working with a local cyclist, recorded readings of 35 micrograms per cubic metre in peak hours—far exceeding the WHO’s 10 μg/m³ guideline—along the A206 and A282 routes.
Jon Cuthill, an environmental correspondent embedded with the project, spent a week cycling the same route at 7:30 AM and 5:30 PM, capturing data that challenges assumptions about rural-urban pollution divides. The A206, a dual carriageway linking Dartford to Gravesend, emerged as the most toxic corridor, with spikes linked to heavy goods vehicle traffic and congestion near the Bluewater Shopping Centre junction.
Key Points
- ⚠️ Dartford’s A206 records PM2.5 levels three times the WHO limit
- 🚲 Peak pollution occurs during 7:30–9:00 AM and 4:30–6:30 PM
- 🏭 Industrial zones and HGVs are primary contributors
Researchers fitted the bike with a PurpleAir sensor and a GPS tracker, synchronising real-time pollution spikes with traffic volume data from Highways England. The A282, Dartford’s infamous crossing into London, showed consistent pollution hotspots near the motorway’s toll plazas, where idling vehicles create what one scientist called a “mobile smog chamber.”
| Route | Peak PM2.5 (μg/m³) | Primary Pollutant Source |
|---|---|---|
| A206 (Dartford to Gravesend) | 35 | HGVs and congestion near Bluewater |
| A282 (Dartford Crossing) | 32 | Idling vehicles at toll plazas |
| Quiet Residential (control route) | 12 | Background urban pollution |
Dr. Emma Reeves, the lead researcher from Portsmouth, noted that the study’s most alarming finding was the persistence of pollution even on “low-traffic” days. “We expected weekends or school holidays to show cleaner air, but the data revealed that industrial activity and freight logistics don’t pause for school breaks,” she said. The team also discovered that cyclists and pedestrians face disproportionate exposure due to their proximity to tailpipes and the lack of protective infrastructure.
💡 Pro Tip
Wear a mask certified for PM2.5 filtration (look for N95 or FFP2 ratings) when cycling along the A206 or A282, and avoid peak hours where possible. Route your journey through side streets like Priory Road or Watling Street for a 40% reduction in exposure.
Local authorities have yet to respond formally, but Dartford Council confirmed it is reviewing the findings with a view to implementing air quality action zones. Campaigners from the Dartford Clean Air Coalition argue the data demands immediate measures, including lower speed limits for HGVs and mandatory retrofitting of diesel trucks with particulate filters. “This isn’t just about cyclists—it’s about every resident breathing this air,” said coalition spokesperson Priya Mehta.
📋 By The Numbers
- 14 days — Length of the monitoring period
- 9 miles — Daily distance cycled for data collection
- 40% — Potential reduction in exposure by avoiding major routes
The study’s methodology has drawn praise from air quality experts, who highlight its use of mobile sensors as a cost-effective alternative to fixed monitors. Dr. Reeves added: “Fixed stations give us averages, but people don’t spend their lives in one spot. This bike-based approach shows how pollution varies street by street.” The University of Portsmouth team plans to expand the project to other Kent commuter routes, including Canterbury and Maidstone, later this year.
- Carry a portable air sensor — Devices like the Atmotube cost under £100 and provide real-time alerts.
- Plan routes using pollution data — Apps like BreezoMeter or Plume Air Report offer hyperlocal forecasts.
- Support freight retrofitting schemes — Lobby your MP to back grants for hauliers to upgrade to cleaner engines.